

Structure Is All You Need

Enhancing AI Retrieval Systems with Structured Data
I’ve previously written about GraphRAG, a form of Retrieval-Augmented Generation (RAG) that combines the power of vector embeddings with knowledge graphs (KG). While traditional RAG relies solely on vector-based similarity searches to retrieve relevant information, GraphRAG introduces knowledge graphs to represent and traverse relationships between entities, concepts, and facts. This combination allows GraphRAG to enhance language model responses with more accurate, contextual, and explainable information.

The key takeaway from GraphRAG is the pivotal role that data structure plays in enhancing retrieval systems. By extracting and leveraging the inherent structure within your data—whether through knowledge graphs or other forms—you can significantly improve the accuracy and context of information retrieval. Instead of fixating solely on constructing a 'graph' or relying exclusively on unstructured data sources, focus on identifying and leveraging any structural elements within your data to enhance the retrieval process.
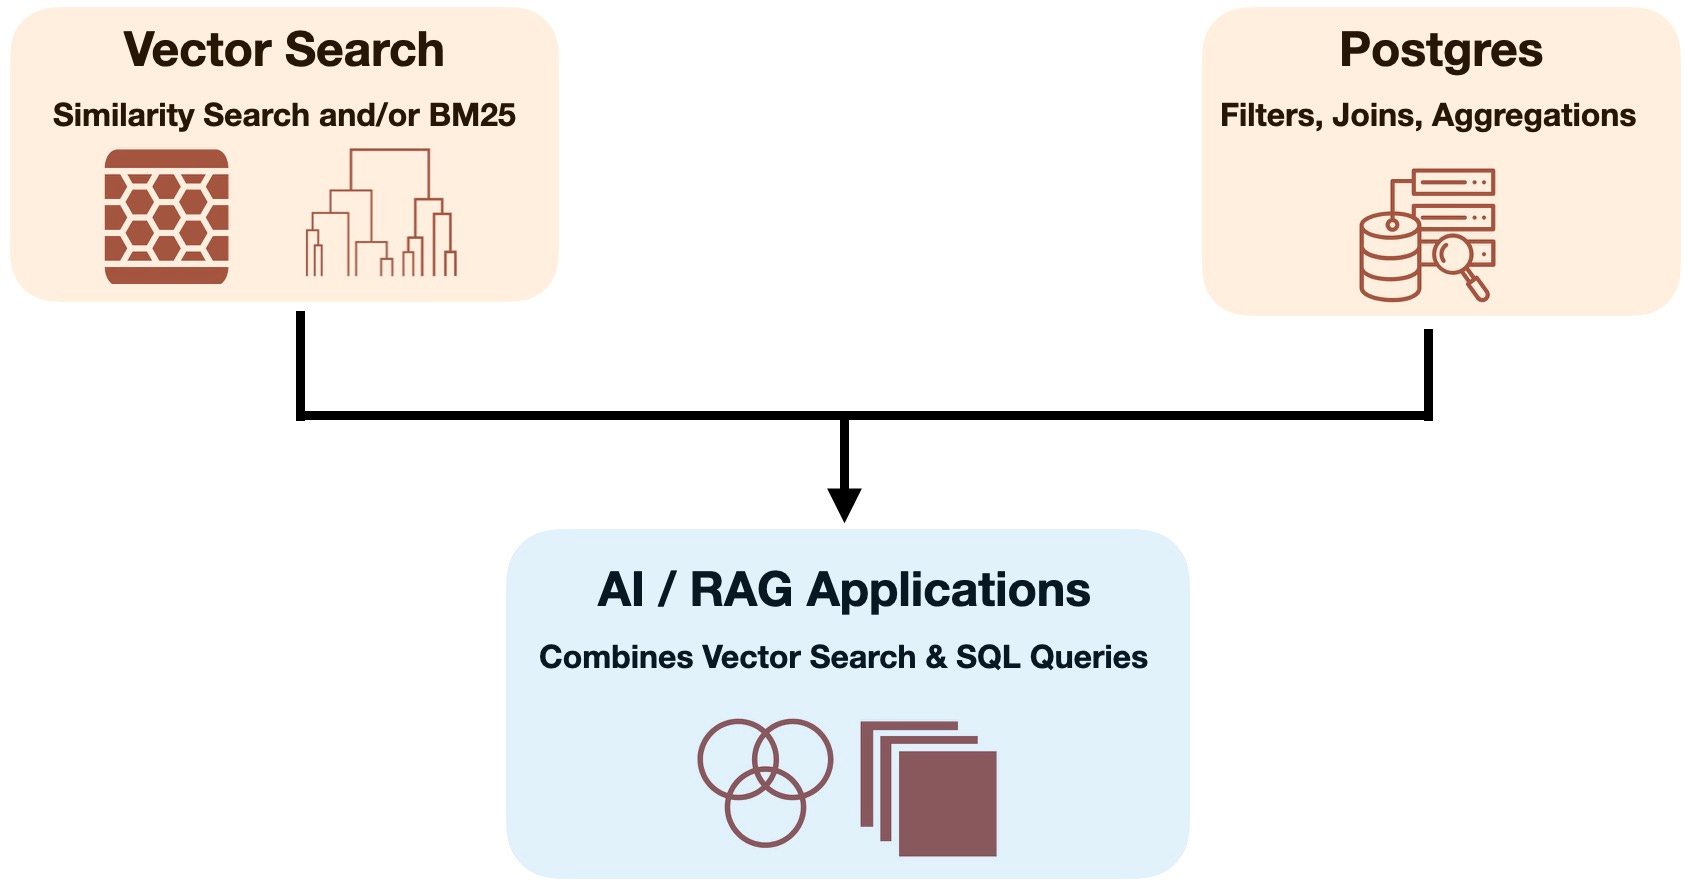
For instance, a team at Timescale recently proposed a hybrid approach that moves beyond simple vector-based similarity searches, enabling complex queries involving time-series data, filtering, and aggregations. By extracting structured information from unstructured sources (e.g., GitHub issues) using language models, developers can store and retrieve data in a way that facilitates precise SQL-based operations. This incorporation of structured data allows for more targeted searches and granular control over query results, significantly improving the performance of RAG systems. For example, it enables querying for “the top five most discussed issues in the last month” or “issues tagged as bugs in a specific repository within a specific timeframe,” tasks that existing vector-only approaches cannot handle.
While the Timescale approach showcases how structured data can enhance simple queries, there are more advanced solutions that address the complexities of processing vast amounts of unstructured, hierarchical data. These methods enable complex retrieval and analysis capabilities, particularly vital for enterprise environments dealing with large-scale document collections.
One such solution is Sycamore, an open-source project that transforms raw, hierarchical documents into a structured format called DocSets. These DocSets are similar to Spark DataFrames but designed specifically for hierarchical documents, containing text, metadata, and relationships between elements like paragraphs, tables, and images. Built on top of Ray, Sycamore enables distributed processing of large document collections, essential for handling the scale of data in enterprise settings. Sycamore maintains lineage information throughout the data transformation pipeline, making it easier to understand how data is processed and debug any issues that arise.

Aryn, the company behind Sycamore, developed it to tackle the challenge of effectively analyzing and querying large collections of unstructured documents in enterprise settings. RAG struggles with complex queries and large datasets. This is critical because enterprises in industries like finance, healthcare, and government rely on these capabilities for tasks such as compliance analysis, document synthesis, and risk assessments. Inadequate solutions lead to inaccurate or incomplete answers that can hinder critical decision-making.
Returning to Graphs: Unlocking Data Insights Through AI and Structure
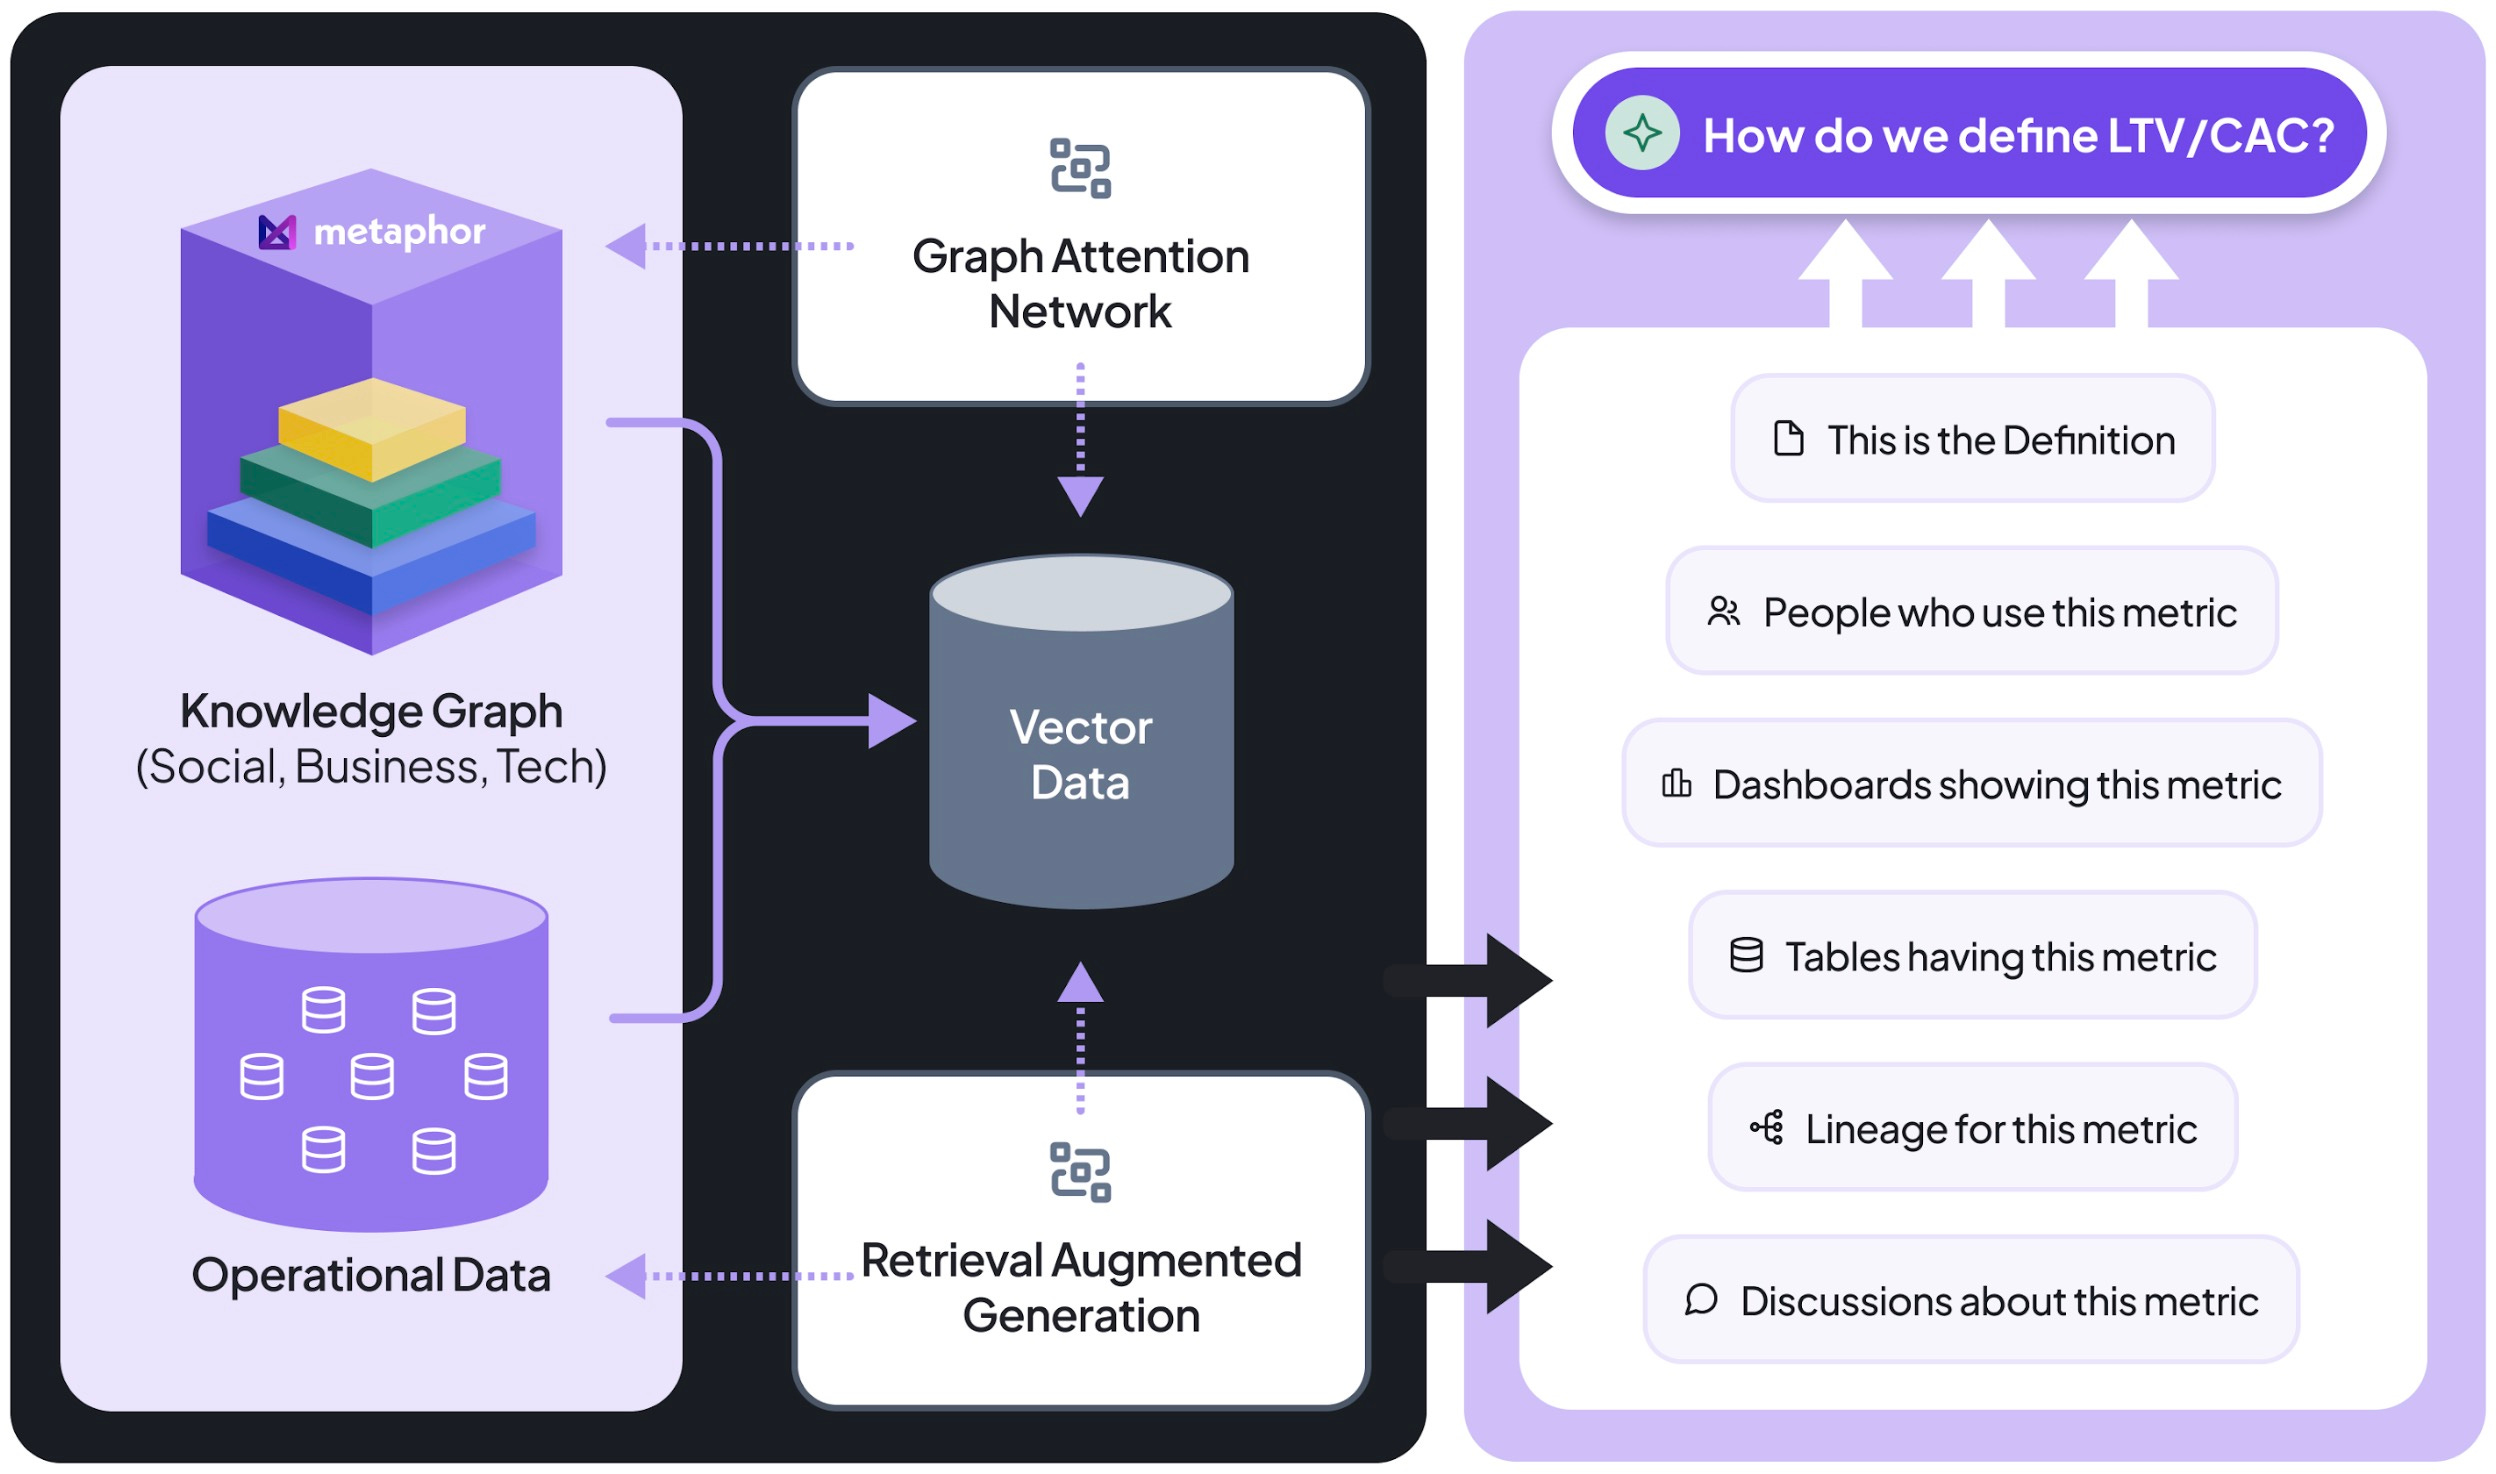
Bringing graphs back into the conversation, I want to highlight a system that integrates diverse, multifaceted graph structures. This application demonstrates how leveraging a series of interconnected graphs can enhance AI and RAG systems, achieving capabilities reminiscent of GraphRAG systems that utilize knowledge graphs derived from unstructured text collections.
Metaphor is an AI-powered social platform for data governance and collaboration that empowers all employees—not just data teams—with AI-driven tools. It facilitates seamless collaboration by connecting all teams, streamlining knowledge sharing, and surfacing relevant insights within an intuitive platform. Metaphor uses AI to streamline data discovery, automate documentation, enhance data accessibility, and simplify data management and decision-making through features like intelligent search, automated lineage tracking, and integrated data quality insights.
To achieve these capabilities, Metaphor leverages a set of interconnected graphs that represent the underlying structure and relationships within an organization's data. By constructing these graphs, Metaphor uncovers additional layers of structure from existing data sources, enhancing retrieval and collaboration across the enterprise.
The Technical Graph, or Lineage Graph, traces data flow and transformations across an organization's tables and columns, providing detailed data lineage. It's built automatically by parsing SQL queries and logs from data warehouses like Snowflake, BigQuery, and Databricks, as well as BI tools such as Power BI and Tableau. By processing these queries, the system creates nodes representing data assets and edges depicting transformations and relationships. This graph is essential for understanding data lineage, performing impact analysis, and supporting data governance by revealing how data moves and transforms within the organization.
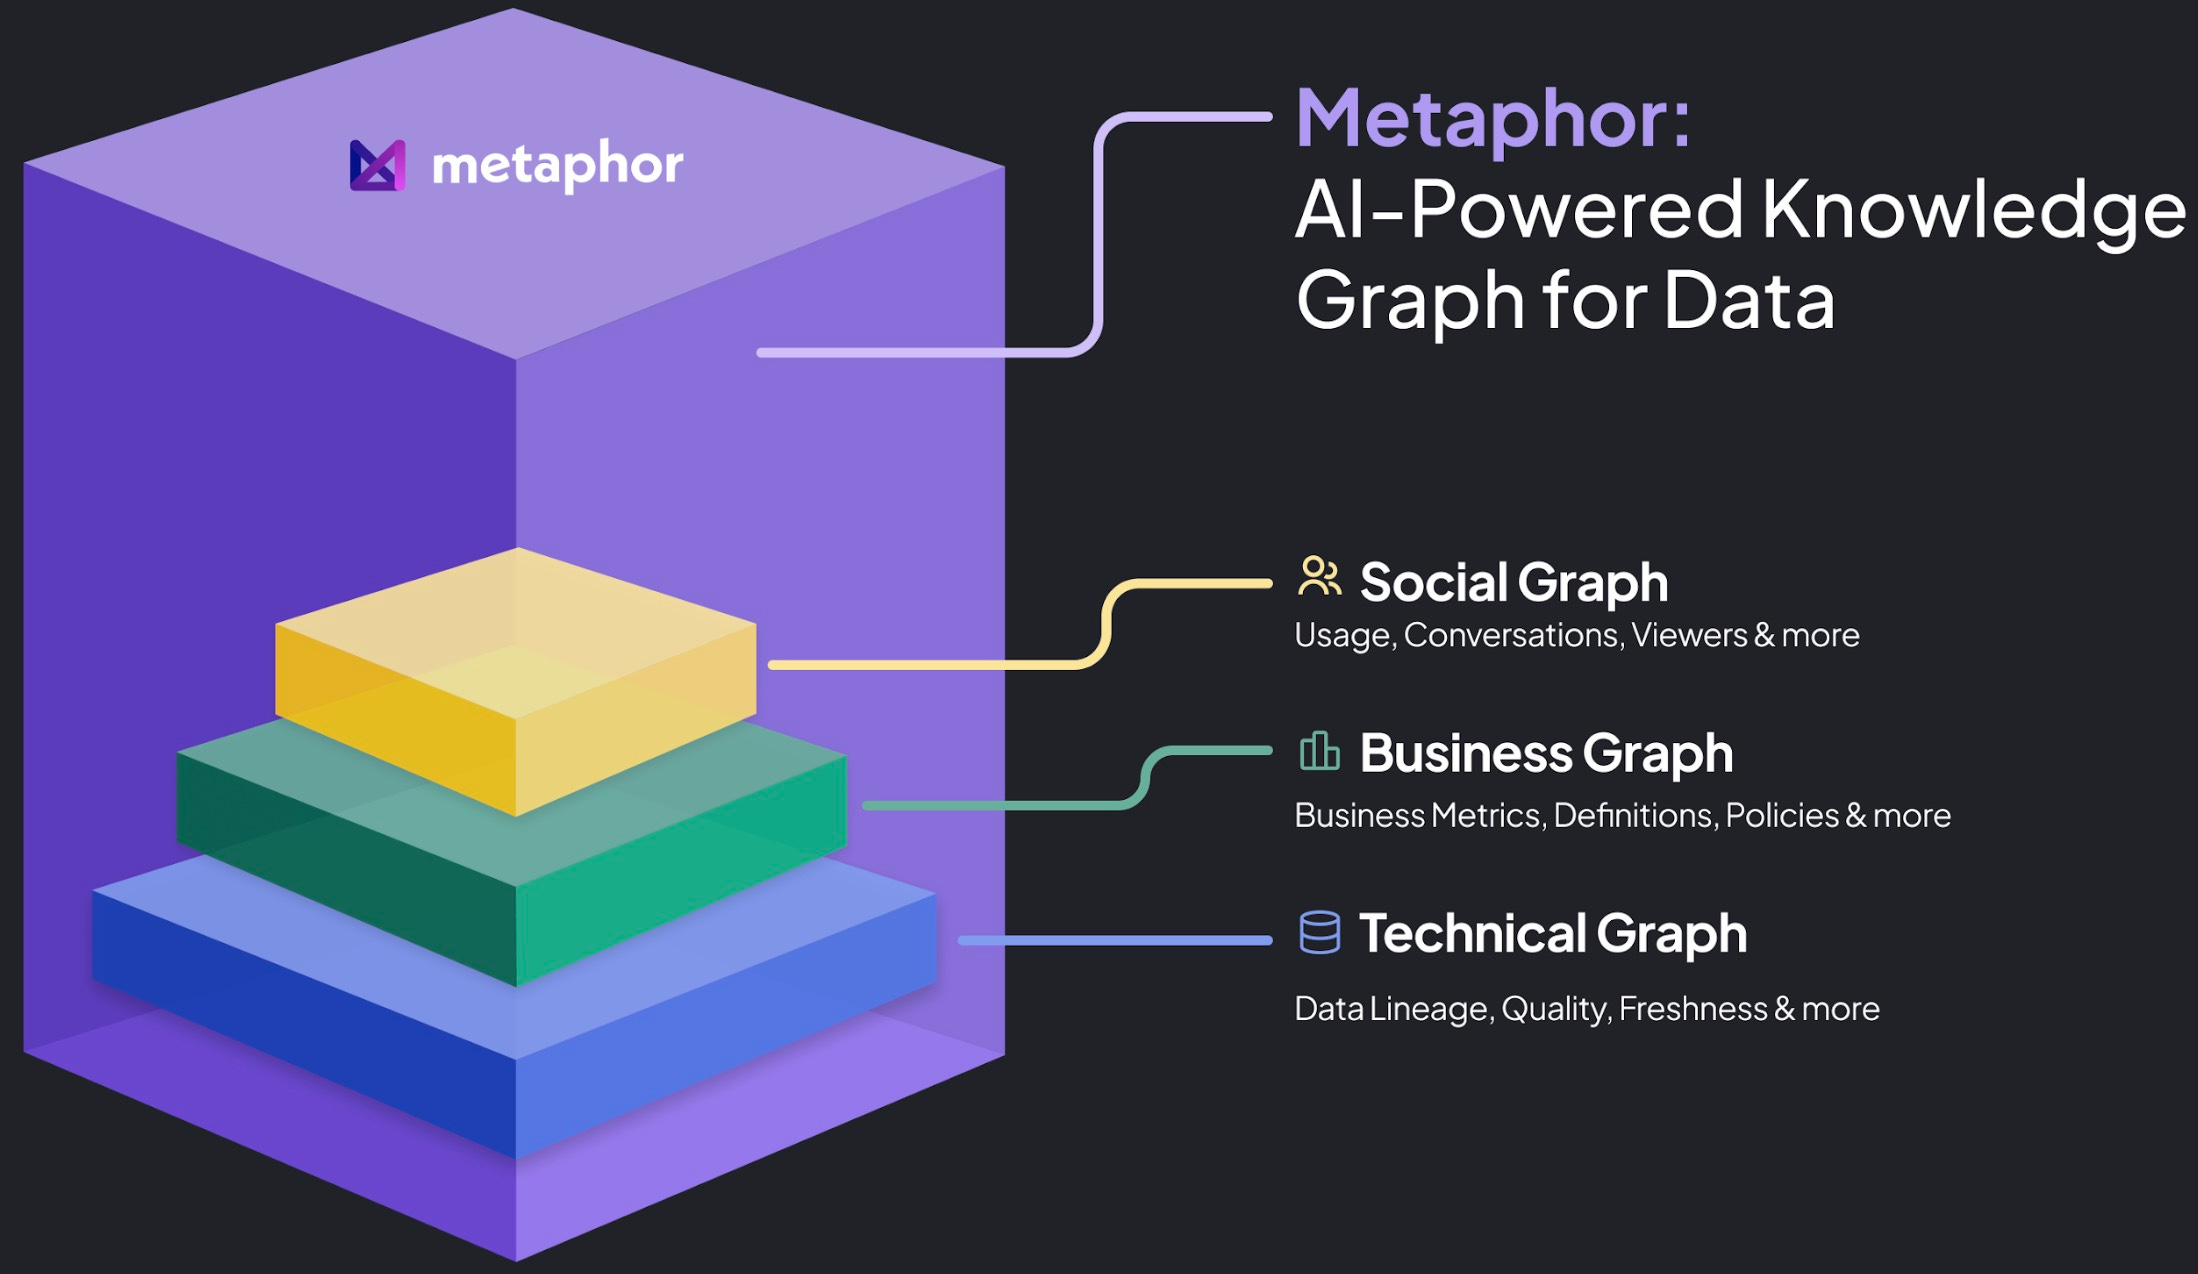
The Business Graph, also known as the Semantic Graph, abstracts the Technical Graph into business-friendly terms by mapping technical data to business entities and simplifying lineage for business users. It is constructed by automatically clustering similar technical entities and using AI to infer business terms, enriching the graph with business definitions and metadata. Leveraging AI-trained, industry-specific models, it associates technical data with business concepts like "Customer" instead of "customer_table_raw." This graph enhances business understanding, facilitates data discovery, and improves collaboration between technical and business teams by making data more accessible to non-technical users.
The Social Graph maps relationships and interactions between individuals and teams, focusing on how people use and collaborate around data within an organization. It's built by combining organizational data from HR systems and team structures with activity logs from BI tools and data warehouses. Individuals are grouped based on their interactions with data—such as shared projects, dashboards, or data queries. This graph provides collaboration insights, helps identify data ownership, and assists in organizing data by naturally grouping teams and individuals around specific data products or domains.
What These Graphs Enable:
Enhanced Data Discovery. Users can discover relevant data assets through both business terms (via the business graph) and social connections (via the social graph), making data discovery faster and more intuitive.
Improved Collaboration. The integration of business and social contexts allows technical and business teams to collaborate more effectively, with clear communication between technical and non-technical users.
Data Governance and Compliance. The technical graph ensures accurate data lineage, while the social graph identifies data owners and users, aiding in compliance and accountability.
Personalized Recommendations. The social graph enables features like personalized recommendations based on users’ interactions with similar data assets, enhancing user experience.
Impact Analysis. Changes in data can be analyzed not only from a technical perspective but also in terms of business impact and affected personnel, leading to better decision-making across teams.
Automation and Scalability. Automating the creation of these graphs allows for efficient management of complex data systems at scale, reducing manual effort in maintaining data lineage and relationships.
The overarching theme is clear: harnessing the structural elements embedded in your data is pivotal for enriching retrieval processes. Whether dealing with unstructured or structured sources, and whether these structures manifest as graphs, knowledge graphs, or tables, the critical factor is recognizing and utilizing this inherent structure. By doing so, you can significantly enrich the retrieval process, leading to more accurate, contextual, and meaningful AI-driven insights.

Data Exchange Podcast
Building An Experiment Tracker for Foundation Model Training. I sit down with Aurimas Griciūnas, Chief Product Officer at Neptune.AI, to explore the complexities of training and scaling LLMs, the critical role of robust experiment tracking, and emerging trends like agentic AI and multi-agent systems. We discuss operational challenges such as fault tolerance, checkpointing, and the transition from research to production, emphasizing the importance of observability and guardrails in AI applications.
Generative AI in Voice Technology. In this episode, we explore cutting-edge voice technologies with Yishay Carmiel, CEO of Meaning, a startup pioneering real-time generative AI systems. We discuss key areas like speech recognition, text-to-speech synthesis, and neural codecs, and tackle the ethical and security implications of these advancements.
If you enjoyed this newsletter please support our work by encouraging your friends and colleagues to subscribe:
Ben Lorica edits the Gradient Flow newsletter. He helps organize the AI Conference, the NLP Summit, Ray Summit, and the Data+AI Summit. He is the host of the Data Exchange podcast. You can follow him on Linkedin, Twitter, Reddit, Mastodon, or TikTok. This newsletter is produced by Gradient Flow.
Thank you for the post! I work a good chunk in Palantir Foundry with my work and I'm trying to understand how their solutions do something similar, but I'm having a hard time making it concrete in my mind